As simple as a paper notebook. Three steps.
Draw your fields
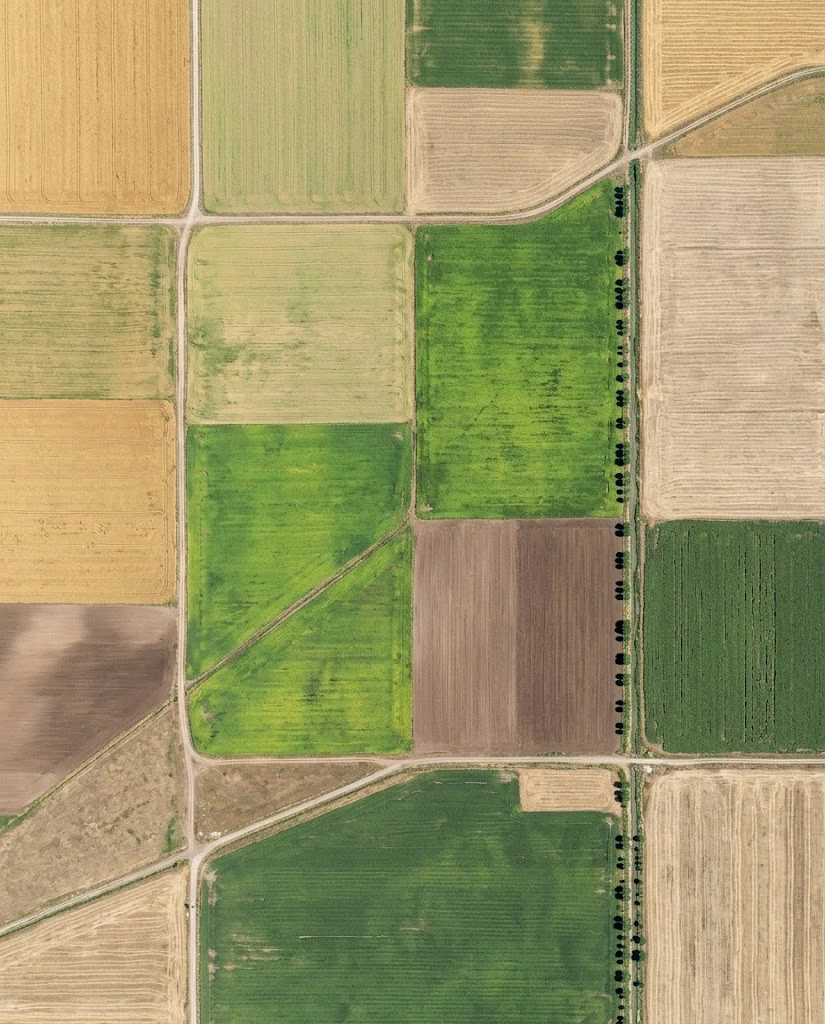
Tap the corners of a field on the satellite map. Its size is calculated, and the field stays there for good.
Log what you do
Tap a field on the map: sowing, fertiliser, spraying, irrigation, harvest. Note how much you used and what it cost.
See the result
Total costs, cost per dekar, expected yield and profit for every field. At the end of the season you know which field paid.
Season to season
Side by side with last year.
Compare every field with its last season, and your fields with each other. Where costs went up, which field slipped, which change paid off: the numbers side by side, at a glance.
| Field | Costs | Yield |
|---|---|---|
| North fieldWheat · 42 da | ₺3,400 → ₺4,000 +18% | 402 → 415 kg +3% |
| By the creekBarley · 28 da | ₺3,100 → ₺3,300 +6% | 370 → 395 kg +7% |
| RoadsideSunflower · 35 da | ₺4,200 → ₺4,100 −2% | 260 → 228 kg −12% |
The notebook does the maths
Not one number. An honest range.
No harvest is guaranteed; there are good years and bad ones. Çiftlik Defterim shows an estimate as a realistic range, not a single number. As your own records build up, the range narrows and the estimate becomes yours.
You enter the selling price; profit is worked out with your numbers.
The whole farm in one notebook.
From the field to the tractor, from the diesel tank to the selling price. Everything has a cost, and it all goes into the same account.
Fields and map
Every parcel on the map, with its crop, size and past seasons one tap away.
Field log
Sowing, fertiliser, spraying, irrigation, harvest, each with date, amount and price.
Tractors and machines
Service, repair and cleaning dates, and what each machine really costs.
Diesel and stock
What's left in the tank and which field used it; seed and fertiliser in store.
Prices
Enter your own buying and selling prices; profit is worked out with your numbers.
Weather
For each field's own location, to plan spraying and harvest days.
Built on Claude
Your farm's own analyst.
Claude reads everything in your notebook together: fields, jobs, costs, past seasons and prices. It tells you not just what happened but why, and suggests what you could do.
Why one field paid and another slipped.
Seasons, fields and crops, using your own data.
Fertiliser, sowing dates, crop rotation and when to sell.
Analysis with Claude · example
Which of my fields slipped this year, and why?
The roadside sunflower field slipped: yield fell from 260 to 228 kg per dekar (−12%) while costs stayed almost the same.
Your records show two differences: this field was sown on 18 April, your other fields between 3 and 8 April. And there's no irrigation logged for it in June.
Suggestion: consider sowing earlier next season and planning at least one irrigation in June. I can work out what that would cost.
Example conversation. Suggestions are based on your own records; the decision is always yours.
Be the first to know.
Çiftlik Defterim is in development. Write to us to join the early version or share an idea.